
Sep
MARKET WATCH * BY THE NUMBERS

Some days I feel like Chicken Little, the sky is falling, the sky is falling. This global pandemic is taking its toll on me and I’m waiting for the other shoe to drop. I hope this note finds you in better spirits and good health. That being said, the Real S. Taitt market is on fire and we continue to hit record price levels and volume of transactions.
The values in Toronto have always been directly tied to supply and demand, and arguably we have never had a surplus of properties for sale in Toronto. We always run with a shortage, hence the bidding wars. Therefore, despite the pandemic my Chicken Little attitude could be all in my head.
The next fourteen days will be very interesting and should establish the direction of the Real Estate market as well as the direction of the pandemic. Based on the seasonally adjusted selling price being down from the previous month by 2.9%, I can say confidently that we are approaching market stabilization. Therefore, marketing strategy, list pricing and consumer expectations requires the expertise of an experienced professional. It is very important to make good choices, right choices moving forward, as the effects of the pandemic are now taking hold.
We had a very busy summer in Real Estate which is not typical and the fall market seems to be off to a strong start as well. We are definitely seeing more homes hit the market this fall which should provide a small window of opportunity for buyers. Choosing the right agent who knows the area and the pulse of the current market to list your home is key. I would love the opportunity to assist you and your family, should the need arise to sell your home in Toronto. Here’s hoping the pandemic goes away soon, like the president south of the border.
market watch
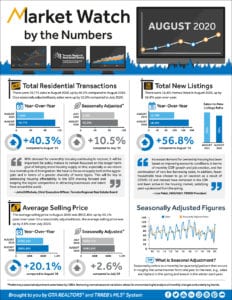
Toronto Regional Real Estate Board (TRREB) President Lisa Patel announced that the strong rebound in Greater Toronto Area (GTA) home sales continued with a record result for the month of August. GTA REALTORS® reported 10,775 residential sales through TRREB’s MLS® System in August 2020 – up by 40.3 per cent compared to August 2019.
Sales were up on a year-over-year basis for all major home types, both in the City of Toronto and surrounding GTA regions. It should be noted that the low-rise market segments, including detached and semi-detached houses and townhouses, were the drivers of sales growth. Condominium apartment sales were up on an annual basis for the second straight month but to a lesser degree.
“Increased demand for ownership housing has been based on improving economic conditions, in terms of monthly GDP growth and job creation, and the continuation of very low borrowing costs. In addition, fewer households have chosen to go on vacation as a result of COVID-19 and instead have remained in the GTA and been active in the housing market, satisfying pent-up demand from the spring,” said Ms. Patel.
Both the number of new listings entered into TRREB’s MLS® System during the month and the number of active listings at the end of the August 2020 were up on a year-over-year basis. While new listings were up strongly for all home types, growth in new condominium apartment listings far outstripped growth in the other market segments.
“Generally speaking, market conditions remained very tight in the GTA resale market in August. Competition between buyers was especially strong for low-rise home types, leading to robust annual rates of price growth. However, with growth in condominium apartment listings well-outstripping condo sales growth, condo market conditions were comparatively more balanced, which was reflected in a slower pace of price growth in that segment,” said Jason Mercer, TRREB’s Chief Market Analyst.
The MLS® Home Price Index Composite Benchmark was up by 11.1 per cent in August 2020 compared to August 2019. Over the same period, the overall average selling price was up by 20.1 per cent to $951,404. Annual detached and semi-detached sales growth was stronger in the comparatively more-expensive City of Toronto compared to the surrounding GTA regions, which helps explain why growth in the overall average selling price outstripped growth in the MLS® HPI Composite Benchmark.